Multimodal inspection / Guide 86
Crop Drone Imagery Validation Before Agronomic Interpretation
Validate crop drone imagery with band provenance, plot registration, acquisition timing, uncertainty, and valid-area coverage before drafting agronomist review notes.
Illustrative engineering guide. Examples are not client deployments, production-ready integrations, or evidence of measured results. Validate the design with your domain and security owners.

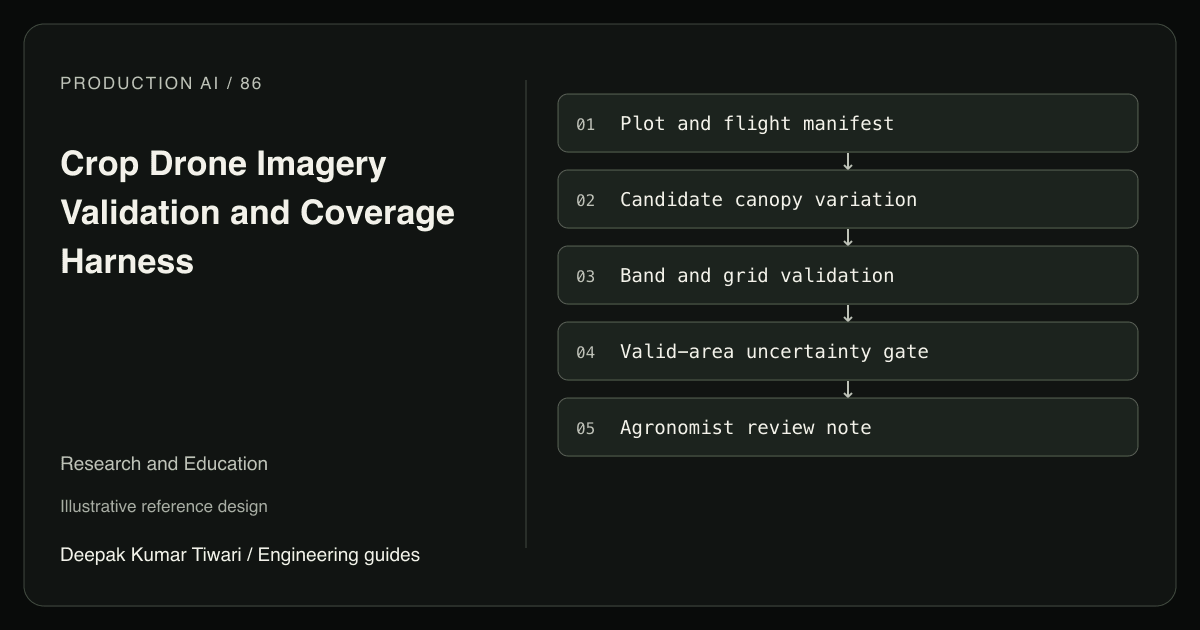
A hypothetical research farm uploads a drone mosaic and asks which plots need treatment. An assistant spots pale canopy patches and labels them nutrient deficiency. The mosaic contains RGB channels only, part of the field is shaded, and the plot boundary file predates a planting-layout change. The visual pattern may deserve investigation, but the requested treatment conclusion is unsupported by the available evidence.
Build a validation workflow that produces agronomist review notes and targeted scouting questions. It should distinguish canopy appearance from a measured vegetation index, and both from diagnosis. RGB does not establish temperature, root condition, or the cause of discoloration. Even a valid multispectral calculation is an observation requiring field context, not automatic permission to apply fertilizer or pesticide.
Preserve the Plot and Acquisition Context
The manifest needs field identifier, plot layout revision, crop and planting record references, flight identifier, capture interval, sensor configuration, and source frame digests. Keep each band’s acquisition provenance and processing revision. A date copied from the final mosaic filename is not adequate time provenance when individual bands or flight strips came from different sessions.
Use a documented projected coordinate system in meters for field boundaries and report raster pixel size in meters per pixel. Image coordinates start at the upper-left corner with columns increasing right and rows increasing down. Band registration must resolve both spatial alignment and effective resolution. Resampling a coarse band onto a fine grid does not create finer independent measurements.
GDAL’s geotransform documentation defines how pixel and line coordinates map to georeferenced space, including pixel-center conventions. Validate transforms rather than assume equally sized arrays align. A one-row shift can mix canopy and bare soil at narrow plot boundaries while leaving the resulting index numerically plausible.
State What the Index Actually Requires
A candidate interpreter can describe spatial variation and propose regions for closer review. A specialist raster stage should validate band identities, reflectance scaling, masks, registration, and acquisition compatibility before computing any index. For this article’s synthetic exercise, define the normalized difference as near-infrared reflectance minus red reflectance, divided by their sum. This explicit arithmetic contract does not imply every vegetation question is answered by that index.
Reject missing near-infrared data rather than substitute the RGB green channel. Check for zero or unstable denominators, nonfinite values, and unsupported reflectance ranges under the declared product specification. Record shaded, cloud-obscured, saturated, and outside-plot cells separately. Missing data should not become a low index value that later gets interpreted as stressed vegetation.
The W3C provenance overview supports tracing derived entities through processing activities. Use that structure to link each plot statistic to band products, calibration records, mask revisions, and the boundary used to aggregate it. If a researcher corrects the plot layout, recompute the statistic under a new result version rather than relabel the old number.
Execute a Synthetic Band Contract
This self-contained Python example tests the HARNESS, not a trained vision model, drone, multispectral camera, or real inspection performance. The reflectance values and coverage gate are synthetic and illustrative. It makes no real media or engine API calls and does not recommend any agronomic treatment.
from math import isfinite

sample = dict(field="F2", layout=5, grid="plot-grid-m-v2",
              source="synthetic-flight-8", captured_s=100,
              bands={"red", "nir"}, registration_m=0.03,
              red=[0.2, 0.0, 0.3], nir=[0.6, 0.0, 0.5],
              valid=[True, True, False])

def index_packet(m, now_s=130):
    if (m["field"], m["layout"], m["grid"]) != ("F2", 5, "plot-grid-m-v2"):
        return "abstain:plot"
    if not m["source"] or not 0 <= now_s - m["captured_s"] <= 60:
        return "abstain:provenance"
    if not {"red", "nir"} <= m["bands"]:
        return "abstain:bands"
    if not isfinite(m["registration_m"]) or not 0 <= m["registration_m"] <= 0.1:
        return "abstain:registration"
    if not len(m["red"]) == len(m["nir"]) == len(m["valid"]) or not m["red"]:
        return "abstain:shape"
    values = []
    for red, nir, valid in zip(m["red"], m["nir"], m["valid"]):
        usable = valid and all(isfinite(x) and 0 <= x <= 1 for x in (red, nir))
        values.append((nir - red) / (nir + red) if usable and nir + red > 0.01 else None)
    fraction = sum(x is not None for x in values) / len(values)
    return ("review" if fraction >= 0.8 else "recapture", values, fraction)

state, values, fraction = index_packet(sample)
assert state == "recapture" and abs(fraction - 1/3) < 1e-9
assert abs(values[0] - 0.5) < 1e-9 and values[1:] == [None, None]
assert index_packet(dict(sample, bands={"red", "green", "blue"})) == "abstain:bands"
assert index_packet(dict(sample, layout=4)) == "abstain:plot"
assert index_packet(dict(sample, registration_m=0.4)) == "abstain:registration"
print("crop imagery harness: five assertions passed")
Only one of the three planned cells supports an index. The zero denominator remains unknown rather than creating an extreme score, and the masked cell stays excluded. The fraction uses equal-area synthetic cells; a production polygon aggregation must account for cell intersection area and the requested plot footprint. Neither the calculated value nor the coverage state establishes plant health.
Carry Uncertainty Into Plot Summaries
Retain radiometric calibration uncertainty, band-registration uncertainty, and boundary uncertainty separately. Near a small denominator, slight reflectance changes can cause large index changes. NIST’s uncertainty guidance emphasizes the measurement relationship and covariance. Shared illumination or calibration effects can correlate errors across an entire plot, so averaging more pixels does not necessarily eliminate them.
Report valid observed area divided by planned plot area, with excluded reasons visible. Avoid a field-wide average that conceals one entirely unobserved plot. Compare dates only after checking crop stage, acquisition conditions, processing methods, and registration compatibility. The same modality and location boundary appears in solar drone inspection, though the downstream specialist and measurements differ.
A deterministic raster validator should own arithmetic and metadata checks. A specialist agent adds value only when it brings a distinct approved knowledge source or organizes agronomist review. Multiple model interpretations of one pale patch do not establish the cause. Use the broader agriculture advisory workflow to combine validated observations with field records without collapsing uncertainty into a treatment order.
Acceptance Tests and Evaluation
- Supply RGB-only imagery; reject a near-infrared index request while preserving a neutral appearance observation.
- Shift one band by a pixel; require registration correction before computing plot statistics.
- Set both reflectances to zero; produce unknown rather than a divide-by-zero error or invented stress class.
- Remove half a plot through a visibility mask; calculate coverage against its planned area, not remaining valid pixels.
- Replace the boundary revision after processing; require recomputation and preserve the previous result lineage.
- Insert treatment instructions into a filename; do not let untrusted media metadata authorize an agronomic action.
Evaluate against independently reviewed plot-flight pairs, not randomly selected neighboring pixels. Measure invalid products admitted divided by all invalid products, valid-area accounting error per planned plot, and reviewer corrections per packet. Keep low-coverage plots in reports. Start with a baseline that displays mosaics and manually assembled notes, then assess whether validation catches specific metadata mistakes without overwhelming scouting teams.
Server-side authorization must isolate farm data and research permissions. The fixture omits trusted calibration registries, authentication, persistent approvals, transactions, and external task-system semantics. Approved scouting tickets need stable plot-flight identifiers; after an uncertain write, reconcile before retrying. Data engineering services should first implement the band contract and coverage report, with human review retained before any field intervention.